IC Markets Home Sign in Web Trader Contact Us
IC Markets Social IC Markets Social

Information Hub for
Serious Traders

  • ABOUT US
  • OPEN LIVE ACCOUNT
  • OPEN DEMO ACCOUNT
  • TRADE NOW
  • VISIT OUR BLOG
IC Markets Social
  • ABOUT US
  • OPEN LIVE ACCOUNT
  • OPEN DEMO ACCOUNT
  • TRADE NOW
  • VISIT OUR BLOG
June 26, 2024North_American_Stocks_ptIC Markets

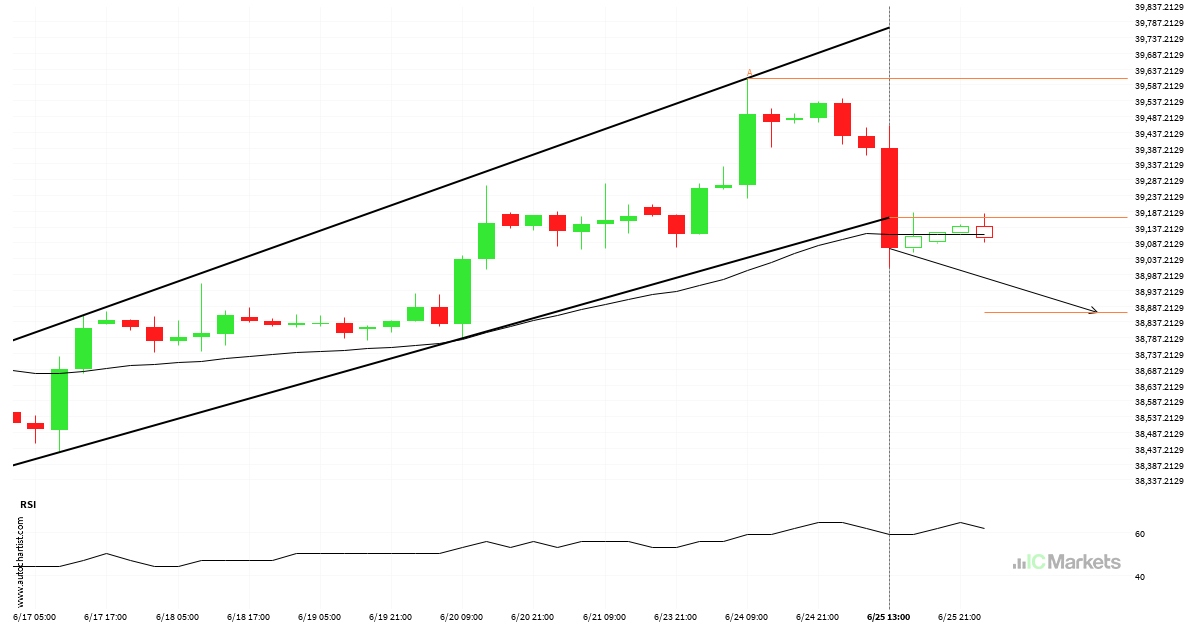
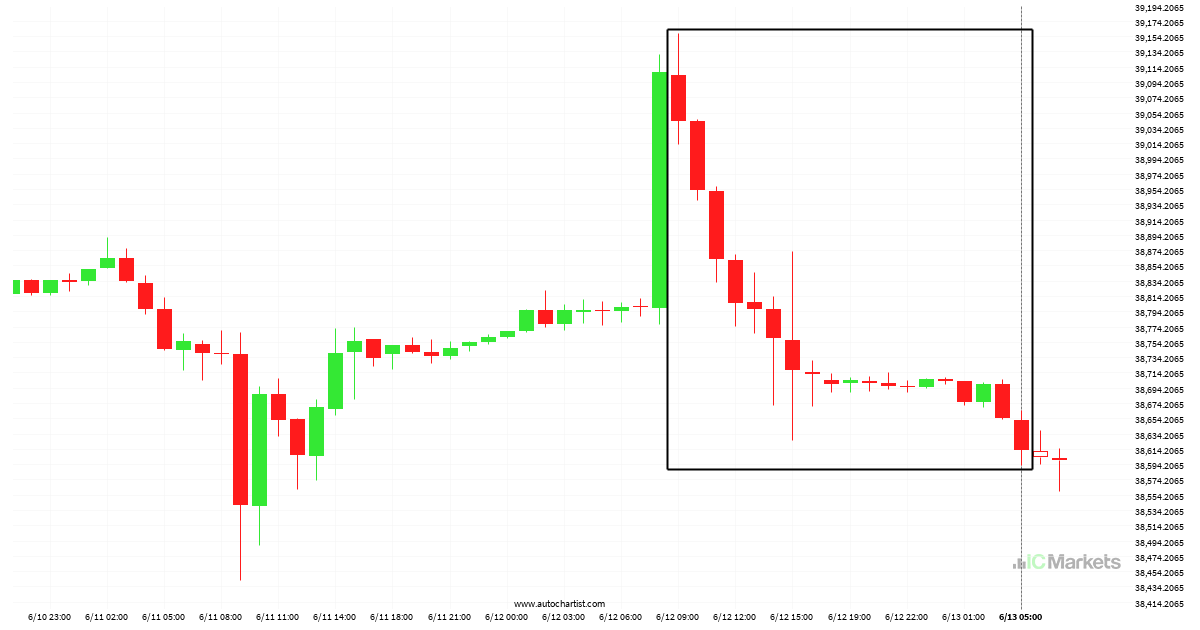
US Wall Street 30 Index Nível visado: 38867.4126

Canal ascendente quebrou na linha de suporte em 25-jun-2024 13:00 EDT. Possível previsão de movimento em baixa nos próximos dia para 38867.4126

Read more
June 25, 2024North_American_Stocks_ptIC Markets

US Wall Street 30 Index – Continuation Padrão gráfico – Canal ascendente

Um Canal ascendente emergente foi detectado em US Wall Street 30 Index no gráfico 4 hora. Há um possível movimento em direção ao 39299.8765 nas próximas velas. Uma vez atingindo resistance, pode continuar sua tendência bearish ou reverter para os níveis atuais de preço.

Read more
June 24, 2024North_American_Stocks_ptIC Markets

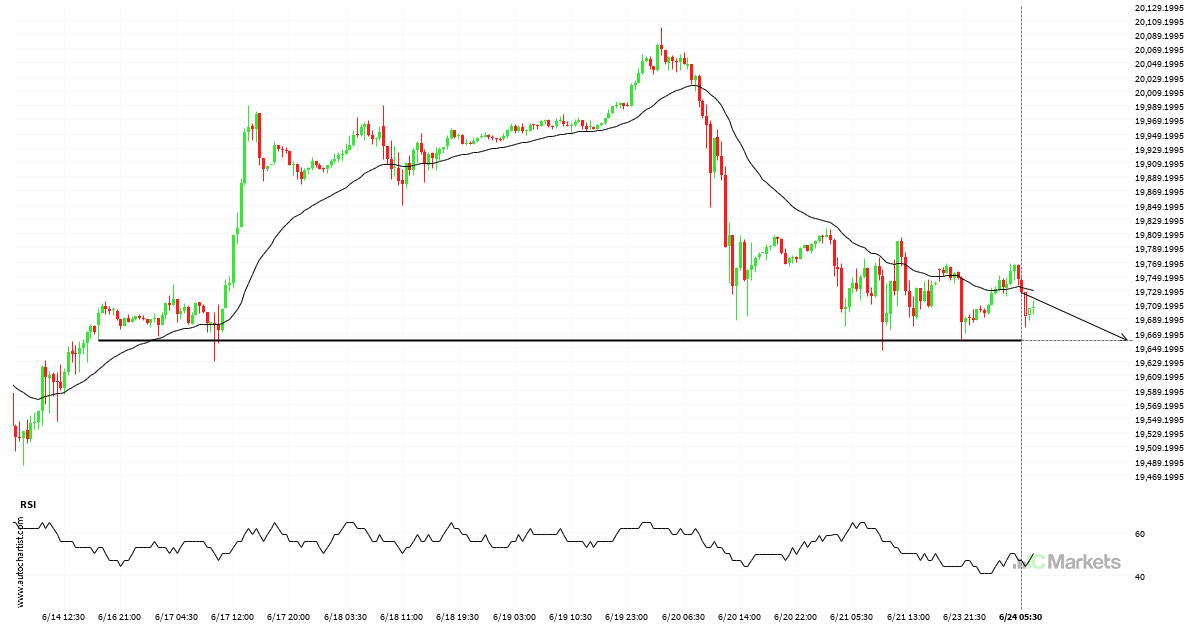
US Tech 100 Index Nível visado: 19659.3809

Aproximando-Apoiar nível de 19659.3809 identificado em 24-jun-2024 05:30 EDT

Read more
June 21, 2024North_American_Stocks_ptIC Markets

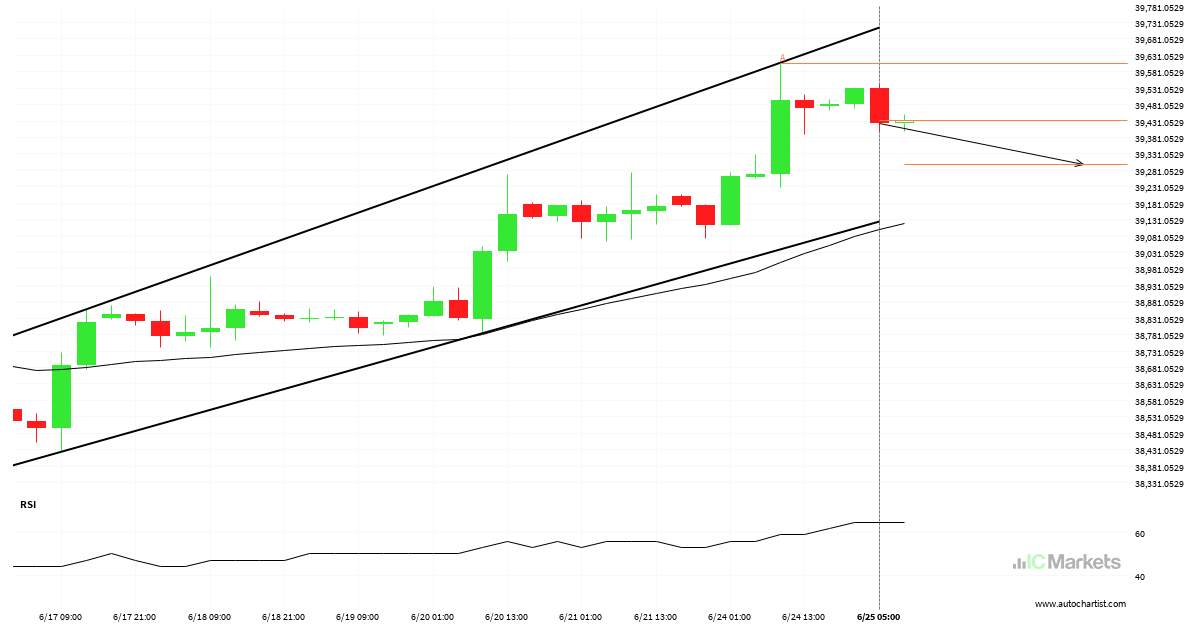
Meta Platforms, Inc. – Class A Common Stock – Continuation Padrão gráfico – Canal ascendente

Um Canal ascendente emergente foi detectado em Meta Platforms, Inc. – Class A Common Stock no gráfico 4 hora. Há um possível movimento em direção ao 488.5327 nas próximas velas. Uma vez atingindo resistance, pode continuar sua tendência bearish ou reverter para os níveis atuais de preço.

Read more
June 19, 2024North_American_Stocks_ptIC Markets

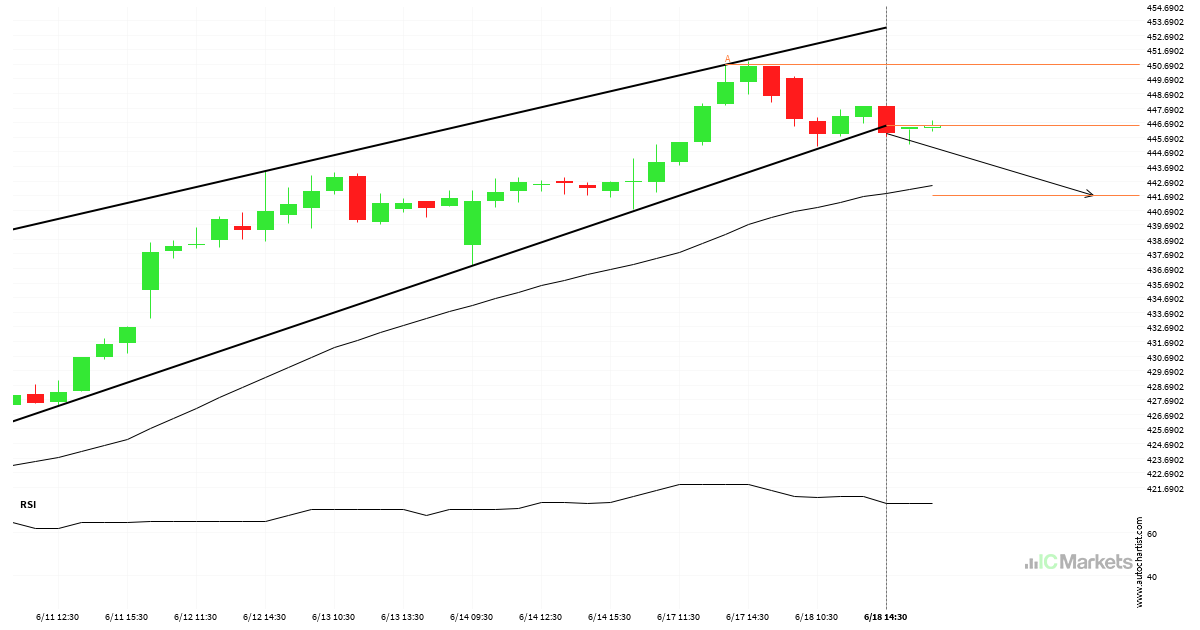
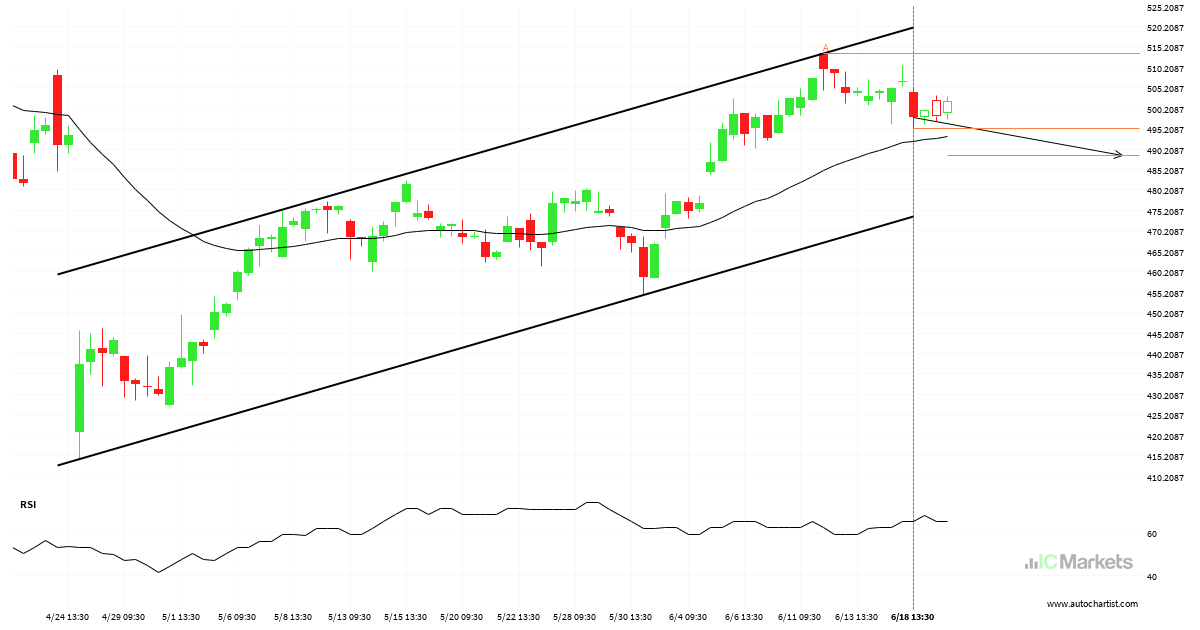
Microsoft Corporation Nível visado: 441.7171

Canal ascendente quebrou na linha de suporte em 18-jun-2024 14:30 EDT. Possível previsão de movimento em baixa nos próximos 10 horas para 441.7171

Read more
June 17, 2024North_American_Stocks_ptIC Markets

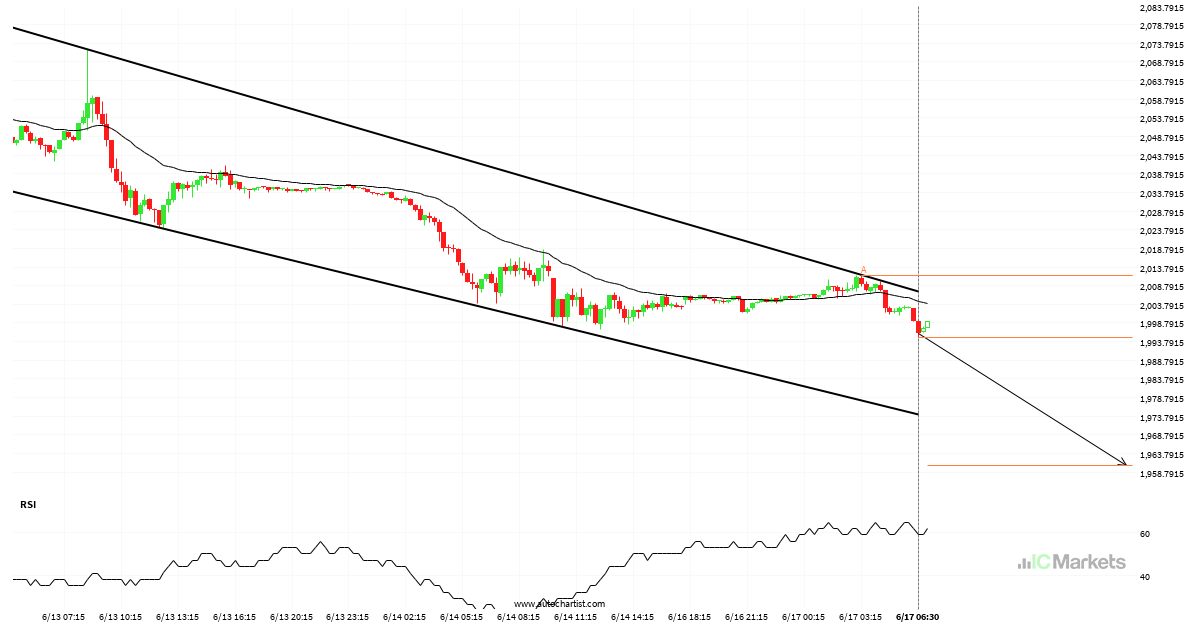
US Small Cap 2000 Index – Reversal Padrão gráfico – Canal descendente

Um Canal descendente emergente foi detectado em US Small Cap 2000 Index no gráfico 15 Minutos. Há um possível movimento em direção ao 1960.6762 nas próximas velas. Uma vez atingindo resistance, pode continuar sua tendência bearish ou reverter para os níveis atuais de preço.

Read more
June 14, 2024North_American_Stocks_ptIC Markets

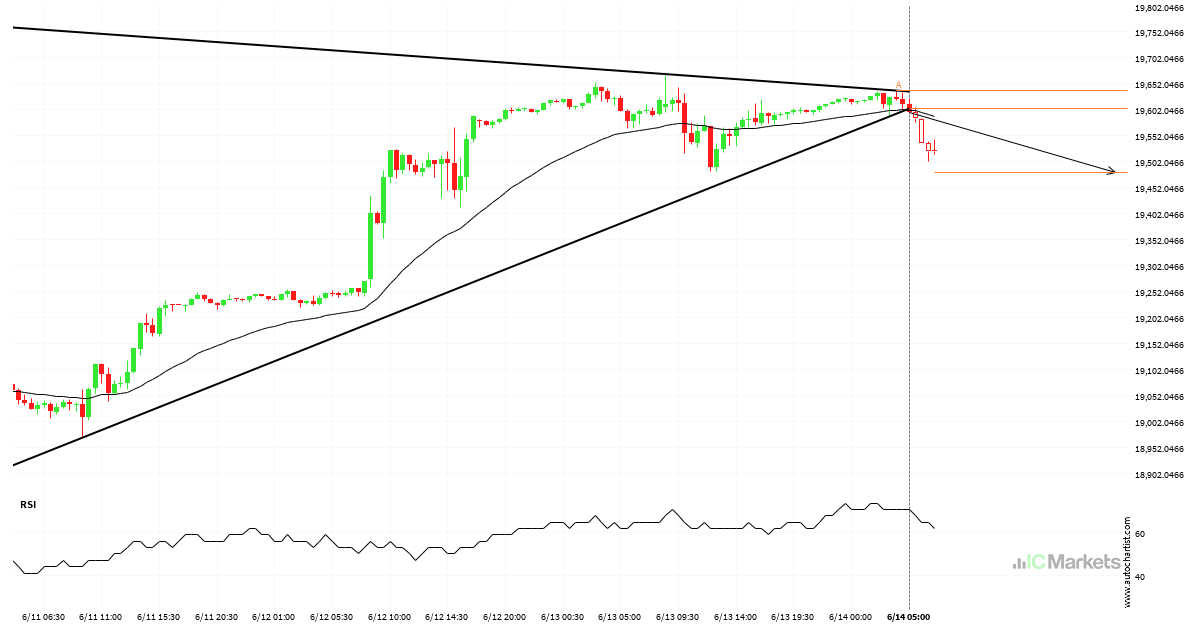
US Tech 100 Index Nível visado: 19482.2788

Triângulo quebrou na linha de suporte em 14-jun-2024 05:00 EDT. Possível previsão de movimento em baixa nos próximos 19 horas para 19482.2788

Read more
June 13, 2024North_American_Stocks_ptIC Markets

US Wall Street 30 Index movendo-se downward, não perca.

US Wall Street 30 Index dropped acentuadamente por 20 horas – o que é um movimento excessivamente grande para este instrumento; excedendo 98% das movimentações de preço passadas. Mesmo que este movimento seja um sinal de uma nova tendência em US Wall Street 30 Index, há uma chance de que testemunhemos uma correção, por mais […]

Read more
June 12, 2024North_American_Stocks_ptIC Markets

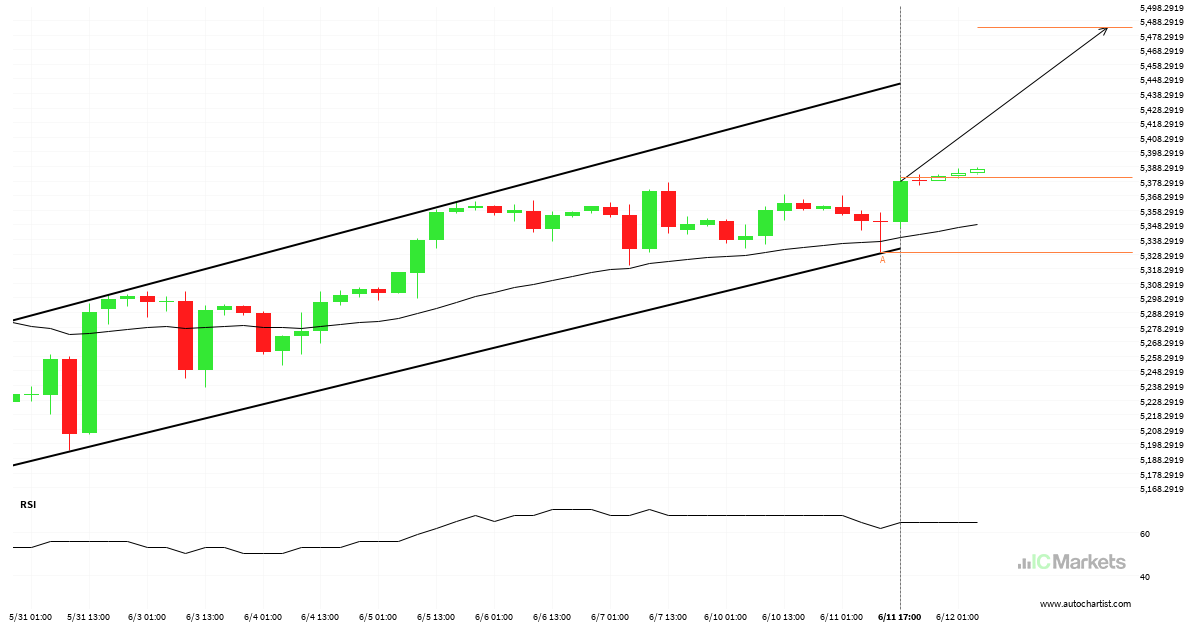
US SPX 500 Index – Reversal Padrão gráfico – Canal ascendente

Um Canal ascendente emergente foi detectado em US SPX 500 Index no gráfico 4 hora. Há um possível movimento em direção ao 5483.3113 nas próximas velas. Uma vez atingindo support, pode continuar sua tendência bullish ou reverter para os níveis atuais de preço.

Read more
June 11, 2024North_American_Stocks_ptIC Markets

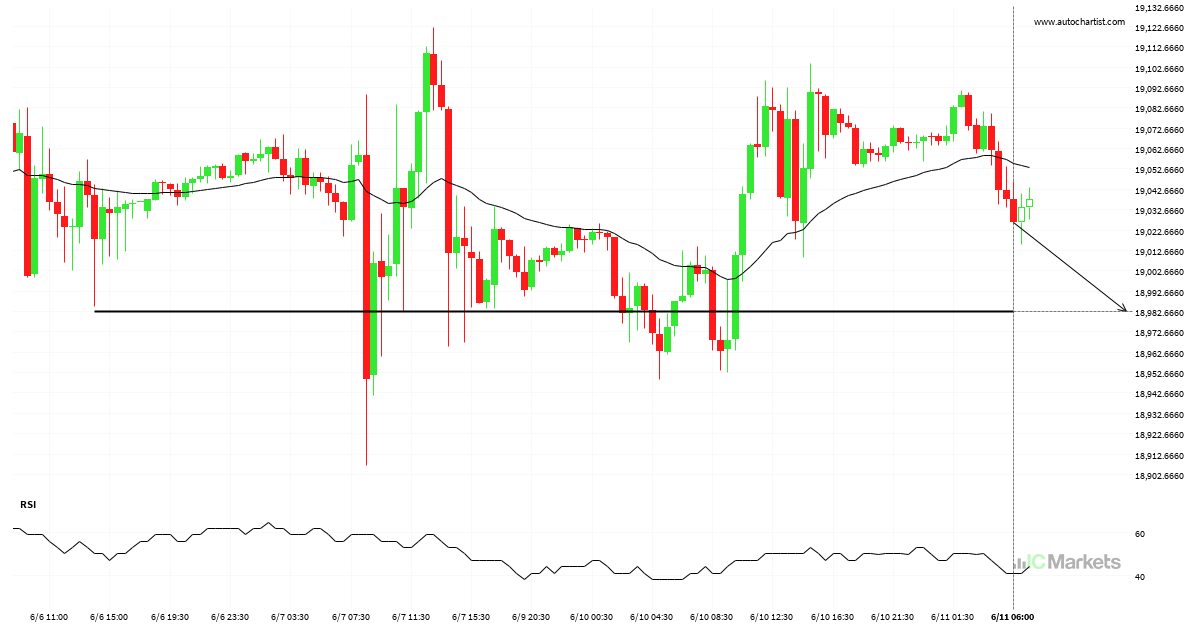
US Tech 100 Index Nível visado: 18982.5605

Aproximando-Apoiar nível de 18982.5605 identificado em 11-jun-2024 06:00 EDT

Read more
  • 1
  • 2
  • 3
  • …
  • 10
  • 11
  • 12
  • 13
  • 14
  • 15
  • 16
  • …
  • 87
  • 88
  • 89

Recent Posts

  • Either a rebound or a breakout imminent on SILVER
  • GOLD Nível visado: 2976.3601
  • A potential bearish movement on GOLD
  • มีโอกาสเกิดการเคลื่อนตัวแบบ bearish บน GOLD
  • Posible gran movimiento en el AUDJPY

Recent Comments

    Translation


     Edit Translation

    Trade with

    a market leader you can rely on

    Open Trading Account Try a Free Demo

    Forex Trading

    • Accounts Overview
    • Open an Account
    • Launch Web Trader

    Trading Specifications

    • Spreads and Commissions
    • Range of Market
    • Trading Hours
    • Funding
    • Withdrawal

    About IC Markets

    • Help Center
    • Why IC Markets
    • Regulation
    • Legal Documents
    • Contact Us


    Forex Trading

    • Accounts Overview
    • Open an Account
    • Launch Web Trader

    Trading Specifications

    • Spreads and Commissions
    • Range of Market
    • Trading Hours
    • Funding
    • Withdrawal

    About IC Markets

    • Chat with a Specialist 24/7
    • Why IC Markets
    • Regulation
    • Legal Documents
    • Contact Us

    Disclaimer: This material is marketing material where all marketing material is published for informational purposes only. This material does not contain and should not be considered as containing - investment advice and recommendations, or suggestions for performing any actions with financial instruments. The built-in widgets belong to their external independent authors, and IC Markets is not responsible for their content and their impact on trade.

    All content rights reserved. Opinions of the authors may not coincide with the opinion of the blog editors. When copying materials from this site or connecting to an RSS feed to republish our articles, a link to IC Markets or attribution in the format ‘IC Markets Blog’ is required. For general questions, please contact the editorial office via the form on the Contact us page.

    Risk Warning: Trading Derivatives carries a high level of risk to your capital and you should only trade with money you can afford to lose. Trading Derivatives may not be suitable for all investors, so please ensure that you fully understand the risks involved and seek independent advice if necessary. A Product Disclosure Statement (PDS) should be considered before entering into a transaction with us.

    The contents of this page are general information only and does not take into account your personal situation, financial objectives or needs. It is up to you to make sure the products that we offer suit your specific needs. You should not trade with us unless you understand the features and risks of the products that we offer. This means that you might need to seek independent advice before you start trading with us.

    © 2022 Raw Trading Ltd | All rights reserved.
    • Sample Page